
Conflict has escalated further in the Middle East following Israeli strikes on Iranian military and nuclear assets on Friday, 13 June. Oil prices lurched upwards on the news, with the benchmark front-month Brent oil future climbing 7% from $69 per barrel to $74 per barrel on the day. Since then, prices continue to drift higher as there are no signs of peace talks. For investors, the conflict resurfaces unpleasant recollections of the energy shock caused by Russia’s invasion of Ukraine in 2022 or for those with longer memories, the oil embargos of the 1970s. However, it is important to remember that history may rhyme but it doesn’t often repeat, and there are key differences between past conflicts and today’s that we believe are worth exploring in this week’s Brief.
There are two key risks from the conflict that could disrupt the balance of oil markets. The first is that Israel may choose to directly strike Iranian oil infrastructure. Roughly 90% of Iran’s crude oil exports are channelled through a single location, Kharg Island in the Persian Gulf.1 Given the capabilities Israel has demonstrated so far, it is an eminently feasible target (it was heavily bombed during the Iran-Iraq War of the 1980s). However, Israel’s military has avoided targeting Iran’s export infrastructure so far. Even in the context of the last week, such an attack would be considered a significant escalation as Iran’s economy relies heavily on oil exports. It would also create an energy shortage risk, which would alienate Israel’s Western allies.
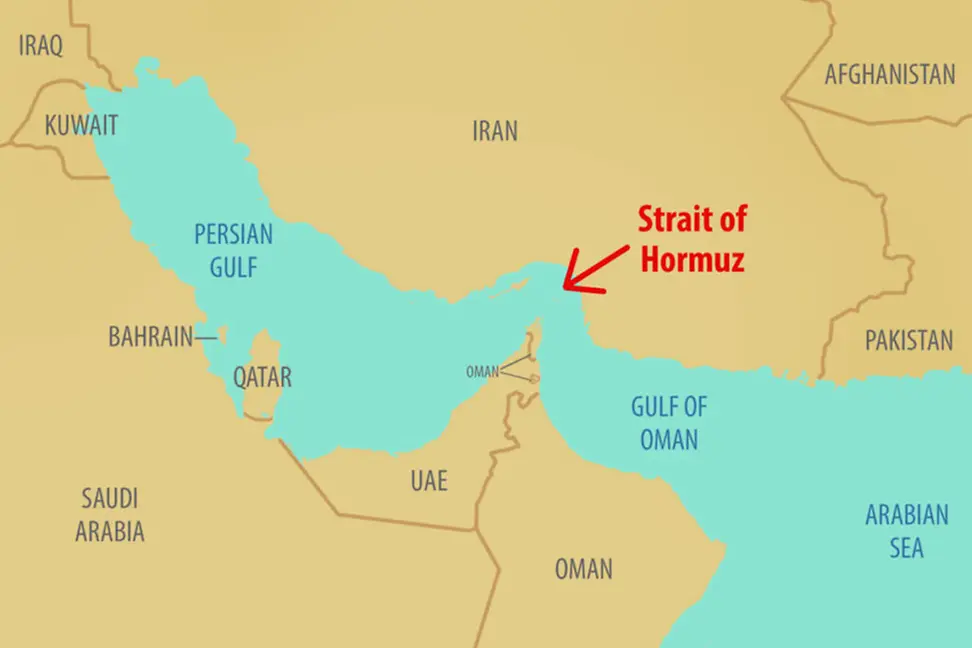
The second possibility is that Iran attempts to interrupt shipping through the Strait of Hormuz (see chart below.) Each day, more than 20 million barrels of oil – roughly 20% of the world’s supply – squeeze through a two-mile-wide shipping lane alongside Iran’s coast.2 With minimal pipelines or deep-water ports available to divert supply to, the global economy is hostage to a stretch of water barely wider than Dover to Calais. While Iran likely lacks the capacity or willingness to fully close the Strait, it can certainly disrupt it. As recently as 2019 there were Iranian attacks on oil tankers in the area, and it is this risk that has already caused a 60% surge in the price of shipping insurance in the Gulf, a cost that feeds directly into oil prices.3 Similarly to Israel, Iran has refrained from this escalation, as this would likely draw in other regional powers, and quite possibly the US and Western allies.
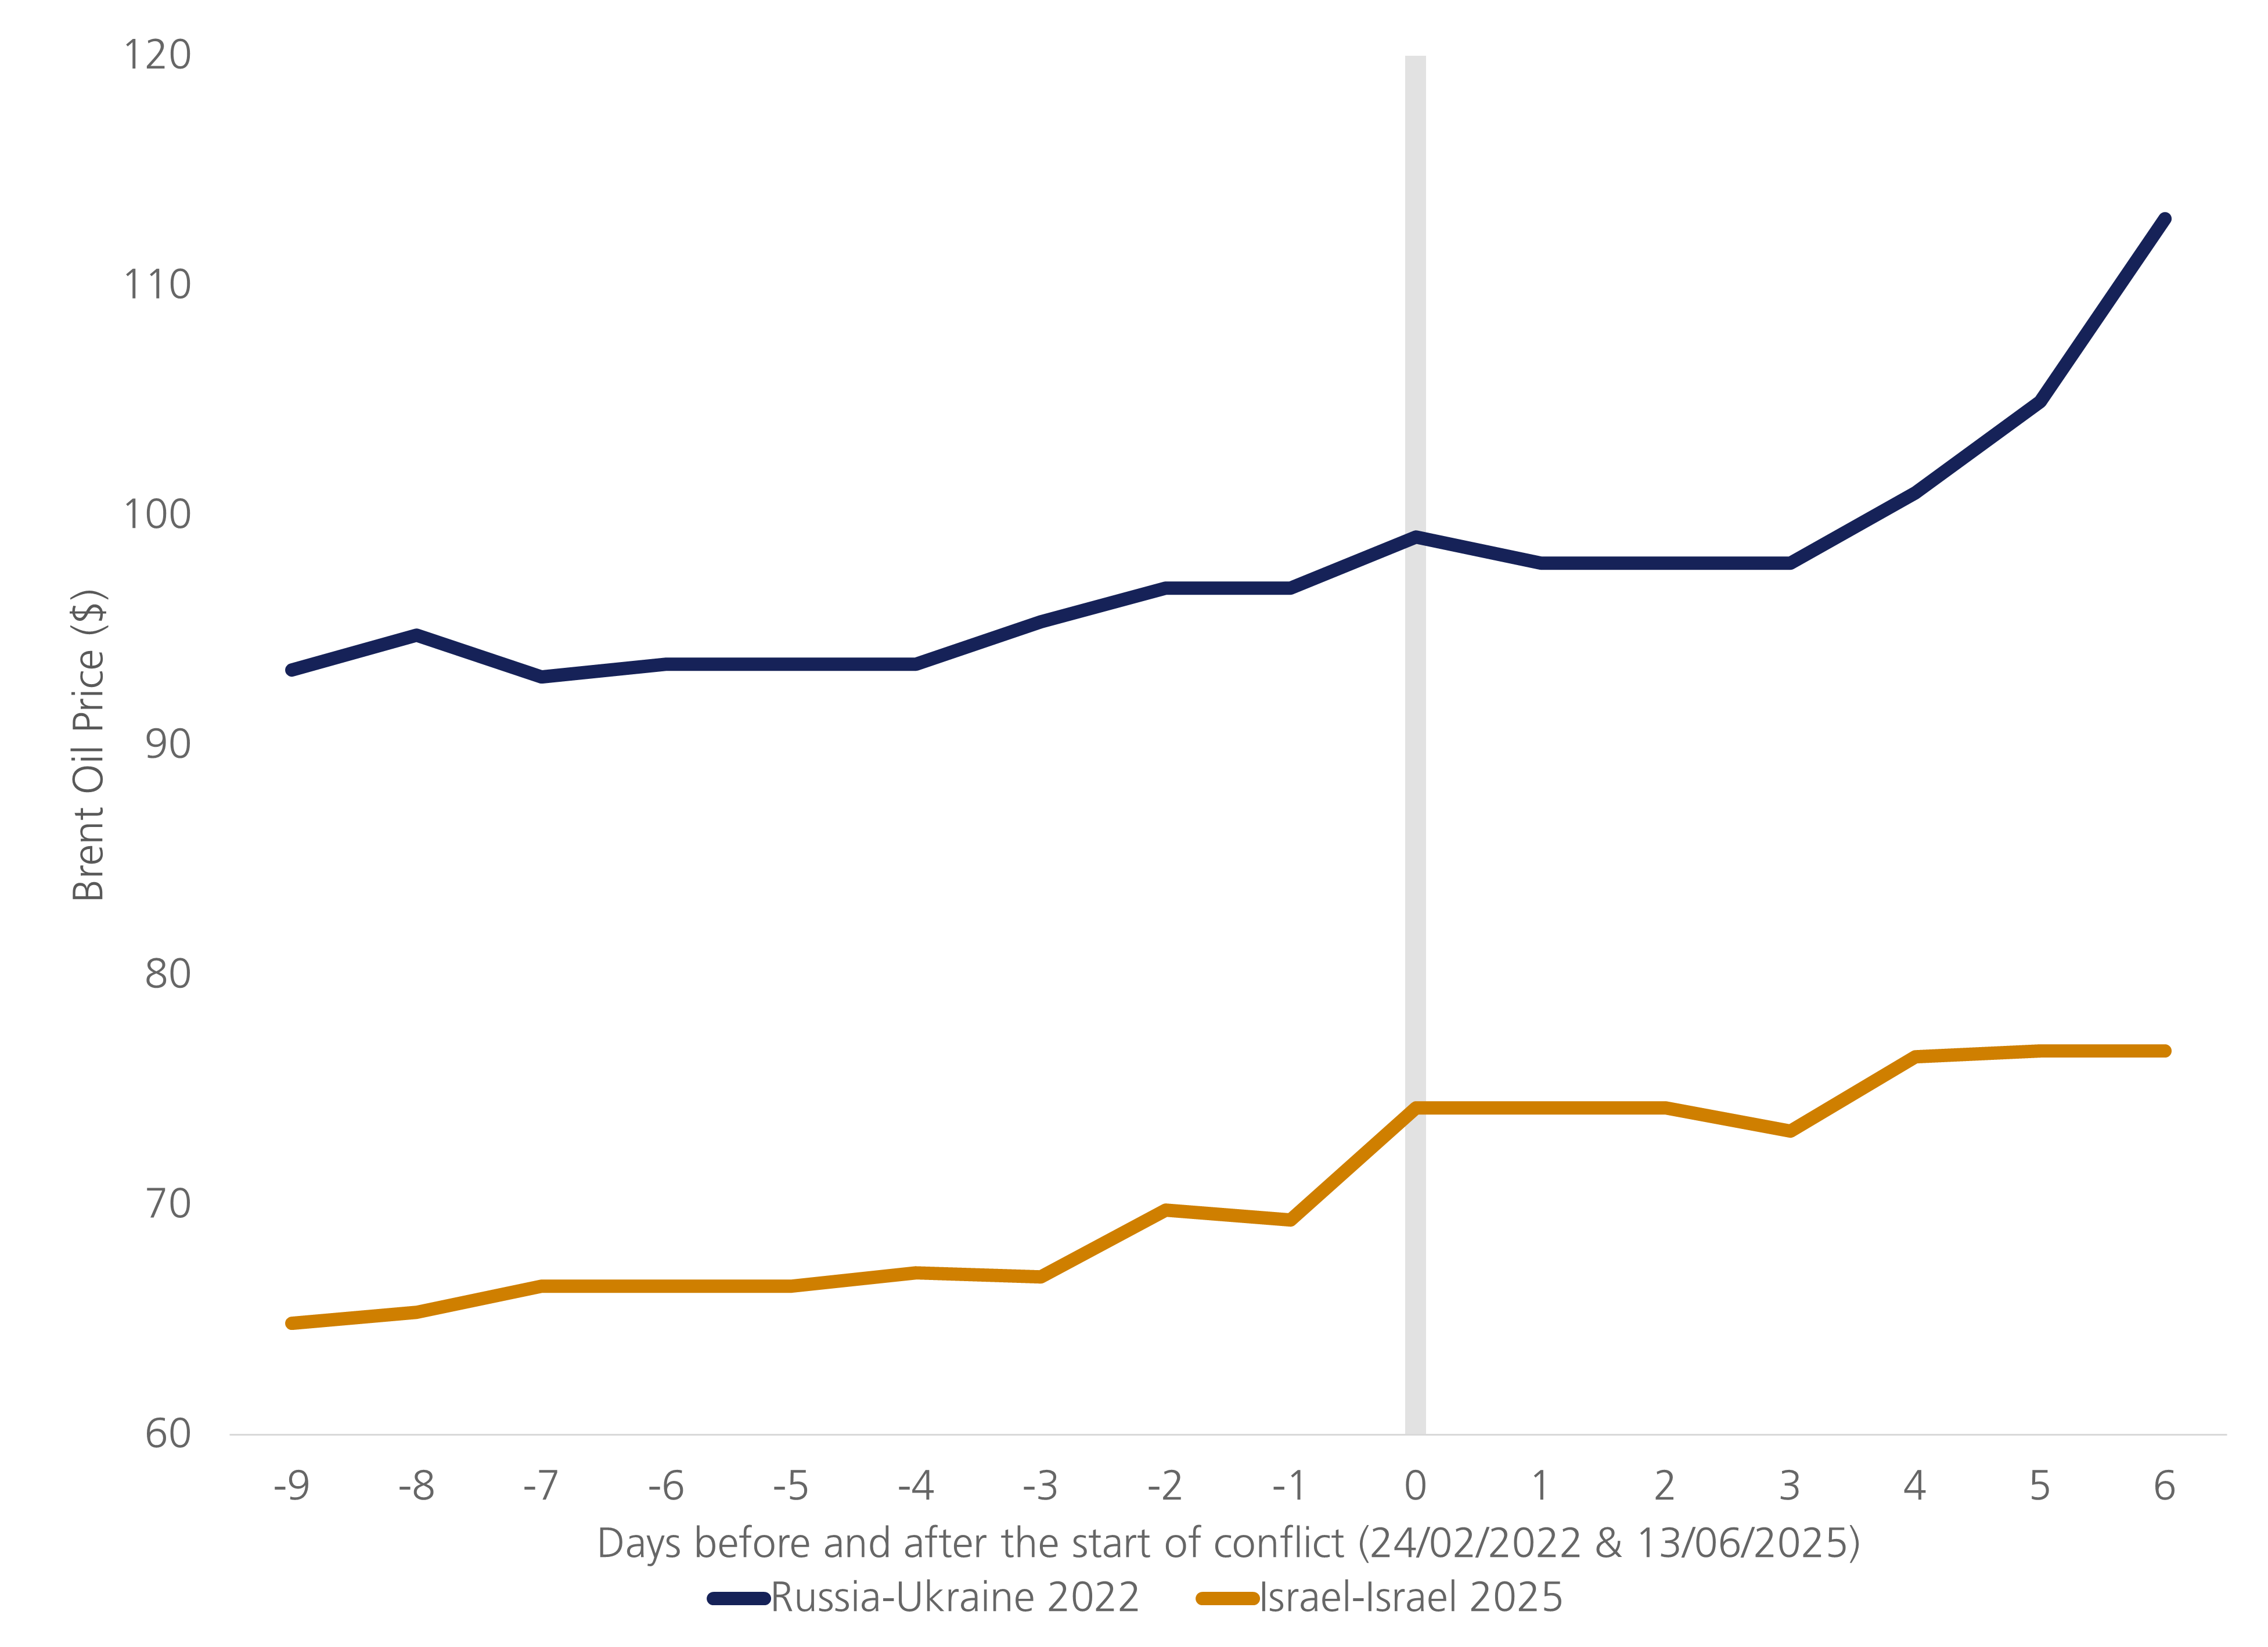
When war breaks out involving one of the world’s ten largest oil producing countries, it is natural for investors to fear spiralling oil prices. The most recent precedent is of course the Russia-Ukraine conflict, which saw prices spike above $120 per barrel in the months that followed Russia’s invasion in 2022. However, the Israel-Iran conflict differs in two key ways.
Firstly, and perhaps most obviously, no physical barrels of oil have gone missing from the global market yet. What has happened to prices so far is a route-risk premium, not a volume-loss shock.
When Russia invaded Ukraine, its exports fell by 1-1.5 million barrels per day in subsequent months, equivalent to losing almost all of Iran’s crude exports.4 Russia’s whole energy supply chain was forced to re-route after Western sanctions were imposed on its exports. Such an outcome is unlikely to occur in this instance, with 90% of Iran’s exports already going to China. Both sides in the Israel-Iran conflict have palpable reasons to not disrupt oil markets, whereas in 2022 there was a rapid impulse to sanction Russia and curtail its revenues by restricting its supply. It also bears mentioning that Russia produces over twice as much oil as Iran, around 11 million barrels per day, to Iran’s roughly 4.5 million.5
Secondly, the global oil market in 2025 has been tipping towards oversupply, in clear contrast to the excess demand in 2021 and early 2022. China and the US account for over a third of global oil demand. With tariffs weighing on sentiment, both have seen their demand forecasts revised down since the start of the year. Meanwhile on the supply side of the equation, The Organisation of the Petroleum Exporting Countries (OPEC+) has started returning the 2.2 million barrels of production cuts it made in 2023 and 2024 to the market. As such, the International Energy Agency is currently projecting a 1.1 million barrel of oil per day surplus in 2025. Contrast this to a supply deficit of 2.3 million barrels per day in 2021, and there is clearly more room for the market to absorb a short-term supply disruption. Furthermore, with Saudi Arabia and the UAE still holding over 3 million barrels per day of spare capacity, it is feasible for other Gulf states to step in if Iran’s infrastructure does become a target.
The result has been a far more muted move in oil prices in the week since the flare up in this conflict compared to three years ago. While near term prices surged on the day of initial strikes, twelve- and thirty-six-month contracts have barely moved, suggesting any interruption would be short-lived and quickly backfilled. In short, the futures curve is waving a warning flag – not sounding the alarm. Therefore, as investors, it is a time to remain vigilant but calm, and hope that a resolution can be achieved in the conflict.
[1] Reuters: https://www.reuters.com/world/china/oil-prices-jump-more-than-4-after-israel-strikes-iran-2025-06-13/
[2] https://www.eia.gov/todayinenergy/detail.php?id=65504
[3] MarshMcLennan, FT: https://www.ft.com/content/fa7dac93-8b4b-45d3-80f5-5ddd527a0d70
[4] International Energy Agency: https://www.iea.org/reports/oil-market-report-april-2022
[5] Energy Institute
LGT Wealth Management UK LLP is authorised and regulated by the Financial Conduct Authority Registered in England and Wales: OC329392. Registered office: 14 Cornhill, London, EC3V 3NR. LGT Wealth Management Limited is authorised and regulated by the Financial Conduct Authority. Registered in Scotland number SC317950 at Capital Square, 58 Morrison Street, Edinburgh, EH3 8BP. LGT Wealth Management Jersey Limited is incorporated in Jersey and is regulated by the Jersey Financial Services Commission in the conduct of Investment Business and Funds Service Business: 102243. Registered office: Sir Walter Raleigh House, 48-50 Esplanade, St Helier, Jersey JE2 3QB. LGT Wealth Management (CI) Limited is registered in Jersey and is regulated by the Jersey Financial Services Commission: 5769. Registered Office: at Sir Walter Raleigh House, 48 – 50 Esplanade, St Helier, Jersey JE2 3QB. LGT Wealth Management US Limited is authorised and regulated by the Financial Conduct Authority and is a Registered Investment Adviser with the US Securities & Exchange Commission (“SEC”). Registered in England and Wales: 06455240. Registered Office: 14 Cornhill, London, EC3V 3NR.
This communication is provided for information purposes only. The information presented is not intended and should not be construed as an offer, solicitation, recommendation or advice to buy and/or sell any specific investments or participate in any investment (or other) strategy and should not be construed as such. The views expressed in this publication do not necessarily reflect the views of LGT Wealth Management US Limited as a whole or any part thereof. Although the information is based on data which LGT Wealth Management US Limited considers reliable, no representation or warranty (express or otherwise) is given as to the accuracy or completeness of the information contained in this Publication, and LGT Wealth Management US Limited and its employees accept no liability for the consequences of acting upon the information contained herein. Information about potential tax benefits is based on our understanding of current tax law and practice and may be subject to change. The tax treatment depends on the individual circumstances of each individual and may be subject to change in the future.
All investments involve risk and may lose value. Your capital is always at risk. Any investor should be aware that past performance is not an indication of future performance, and that the value of investments and the income derived from them may fluctuate, and they may not receive back the amount they originally invested.